Equipments & Technologies
Is your sample pure?
SDC: Stage-discriminated correlation
What are you going to do when the sample you are analyzing on mass spectrometry contains impurity with same m/z value? Fears about the potential problems associated to the contaminated structural isomers such as diastereomers and sequential isomers in your sample always exist. The presence of these isomeric structures cannot be identified by the method based on mass spectrometry. But, this is no longer true. Based on the new method called "stage-discriminated correlation" tells you whether a sample is "pure" or not. (Ref. 1)
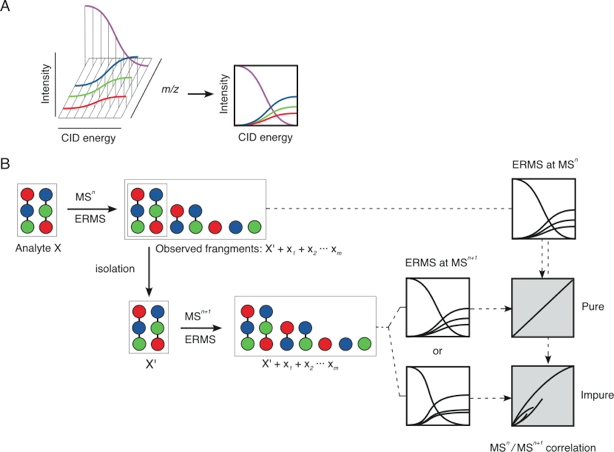
If you own a mass spectrometer capable of carrying out the collision-induced dissociation (CID) that often called MS/MS, you can obtain a very useful spectrum of energy-resolved mass spectrometry (ERMS). (Ref. 2) With the ERMS, you will be able to distinguish structurally related ions having same m/z value. The method allows distinguishing ions of structural isomers such as diastereomers in general.
When QIT-MS (quadrupole ion trap mass spectrometry) is used for obtaining ERMS spectra, important information is obtained. That is ratio of product ions are constant regardless of the applied CID energy. (Ref. 3) The reason of this is the fact that the activated species during the CID conditions is the precursor ion only. Although all the ions should be “activated” in order for those to be trapped, the energy of these ions are in the equilibrium between collision activation and cooling, thus these ions except for the precursor do not fragment.
Using QIT-MS, it is possible to examine the pureness (not the purity) of the sample being analyzed. Let us consider a case that your sample is pure. First, you carry out the ERMS experiment and obtain a spectrum. Having this spectrum in hand, you carry out second experiment by applying certain CID energy where ca 20 to 30 % of the precursor ion is consumed and the remaining precursor ion is “isolated” for the next ERMS experiment. (Note) What you see is the exactly same ERMS spectrum with one obtained beforehand. (Ref. 4) The comparison is made by correlation plot. When two spectra is identical, the curve obtained is y=x. Experimental error results in some deviation.
We now consider a case that your sample is not pure contaminated by a molecule with same molecular weight. Individual molecules have specific activation energies. For this reason, the spectra obtained at separate stages become different, which can be judged by the large deviation.
Note: MS/MS (MS2) is the method of obtaining fragment ions generated from a precursor ion. And, MS3 is to obtain fragments of a fragment generated at the previous stage by definition. Our experiment is therefore is not considered as MS3! Funny, but this was a reason that our manuscript once rejected.
Significance.
The pureness of your sample is obtained just by doing ERMS twice
References (More papers follows, please watch our research!)
-
Daikoku, S. Kurimoto, A. Mutuga, S. Ako, T. Kanemitsu, T. Shioiri, Y. Ohtake, A. Kato, R. Saotome, C. Ohtsuka, I. Koroghi, S. Sarkar, S. K. Tobe, A. Adachi, S. Suzuki, K. Kanie, O.
-
Carbohydr. Res., 2009, 344, 384-394.
-
-
Kurimoto, A. Daikoku, S. Mutsuga, S. Kanie, O.
-
Anal. Chem., 2006, 78, 3461-3466.
-
3.Deconvolution of energy-resolved mass spectrum acquired on a triple quadrupole mass spectrometry providing valuable information equivalent to multi-stage MS/MS data.
-
Kanie, O. Kanie, Y. Daikoku, S. Shioiri, Y. Kurimoto, A. Mutsuga,S. Goto, S. Ito, Y. Suzuki, K.
-
manuscript submitted to Rapid Commun. Mass Spectrom. 2010.
-
-
Kanie, O, Kurimoto, A. Daikoku, S. Mutsuga, S. Kanie, Y. Suzuki, K.
-
Proc. Jpn Acad. Ser. B, 2009, 85, 204-215.
2011/01/05